 29ec717b47
Document features, stack and layout; mark completed milestones and list
deferred nice-to-haves; include verified Electron screenshots.

Co-Authored-By: Claude Opus 4.8 (1M context) <noreply@anthropic.com>
Pipeline Network Diagram Editor
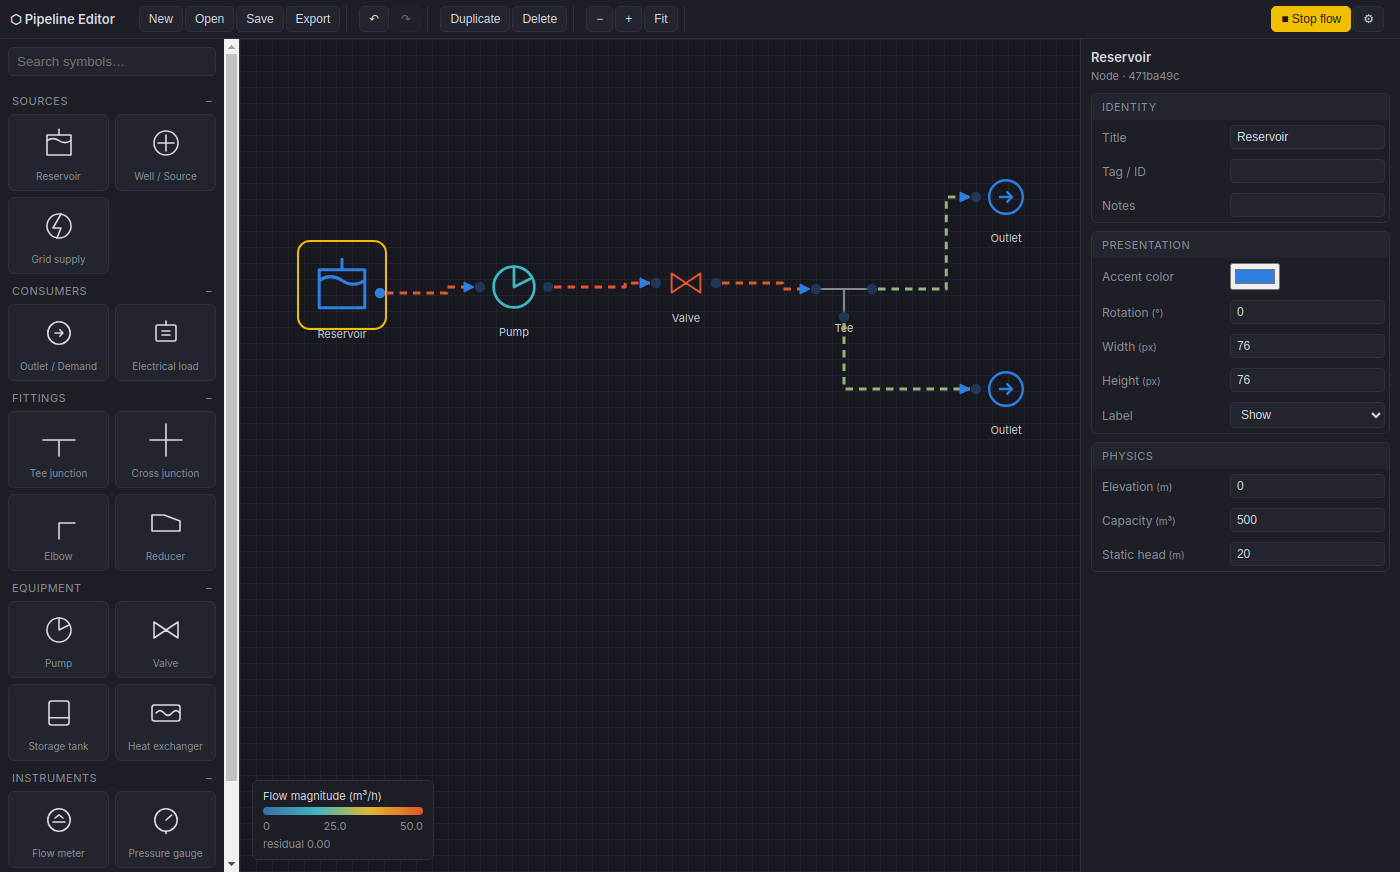
An Electron desktop app for drawing and analyzing pipeline / network diagrams (water, hot water, gas, power, signal…). Nodes are SVG symbols with typed connection ports; connectors are routed orthogonally along a grid and can carry an animated, mass-conserving mock flow.
Features
- Symbol stencil — 16 grouped, searchable SVG symbols (sources, consumers, fittings, equipment, instruments). Drag onto the canvas or double-click.
- Typed ports & media — every port carries a medium (water, power, gas, signal…). Connections are validated: only compatible media may be joined. Swappable color schemes (default / color-blind safe / print).
- Orthogonal routing — grid-aligned manhattan router. Optional jumpover arcs where connectors cross (toggle in Settings).
- Edge styling — line style (solid/dashed/dotted), width, color, and head/tail markers (arrow, open arrow, circle, diamond, bar).
- Grouped, typed property panel — Identity / Presentation / Physics groups
with editors for
string,int,float,enum,color,catalogueItem,catalogueItemsandlistOfValues; live validation with units. - Catalogues — pipe materials, pump models, valve types. Picking an item can seed physics defaults (roughness, flow rate…).
- Mock flow calculation — distributes a conserved flow from sources to sinks, animates direction with marching ants, and encodes volume via speed and a magnitude color ramp. A legend shows the live mass-balance residual.
- Editing — drag with grid snapping, multi-select, delete, copy/paste, duplicate, undo/redo, pan, wheel zoom, fit-to-content, link vertex editing.
- Files — New / Open / Save (JSON) via native dialogs, Export SVG.
- Settings — grid size, snapping, jumpover, color scheme, light/dark theme.
Tech stack
- Electron shell (secure preload, context isolation)
- JointJS core (
@joint/core, MPL-2.0) — canvas engine (custom SVG nodes, ports, manhattan router, jumpover connector) - React 18 + TypeScript — panels and shell
- electron-vite / Vite 5 — build
- Vitest + jsdom — tests
See docs/plan/README.md for the design rationale
(including why JointJS over React Flow / mxGraph) and the full checklist.
Getting started
npm install
npm run dev        # launch the app with HMR
Other scripts:
npm run build      # produce main / preload / renderer bundles in out/
npm run start      # preview the production build
npm run typecheck  # tsc for both node and web project references
npm test           # run the Vitest suite (52 tests)
Project layout
src/
  main/            Electron main process (window, file dialogs IPC)
  preload/         Context-isolated bridge (save/open)
  renderer/
    diagram/       Framework-free domain + JointJS engine
      relations    port media, color schemes, compatibility
      properties   typed/grouped property model (coerce/validate)
      catalogue    reusable lookup tables + physics seeds
      symbols      SVG symbol registry with port layouts
      schemas      node/edge property schemas
      edges        marker/line-style helpers
      settings     grid/router/connector/jumpover config
      flow         mass-conserving mock solver
      flowAnimation marching-ants animator + magnitude ramp
      shapes       JointJS element/link construction
      history      snapshot undo/redo
      controller   Graph + Paper orchestration (headless-capable)
    components/     React UI (stencil, canvas, properties, toolbar, dialogs)
tests/             Vitest suites
docs/plan/         Implementation plan + screenshots
Architecture notes
The diagram/ layer is split so the domain model is framework-free and fully
unit-tested (relations, properties, catalogue, symbols, flow solver), while
shapes.ts/controller.ts bridge it to JointJS. DiagramController accepts a
null host to run headless (no Paper), which is how the controller tests
exercise the full add/connect/edit/delete/undo/flow lifecycle without a browser.